05.06.2025

In This Article
In a time of rising costs, economic uncertainty, and limited housing inventory, more homeowners are choosing to stay put and invest in the homes they already have and love. But that isn’t always easy. Renovating requires a significant financial commitment, months of planning, trade-offs, and a lot of patience along the way.
Block’s How America Renovates report reveals how U.S. homeowners are navigating the journey: how they’re budgeting, what they’re prioritizing, and what they believe it all adds up to in the long run.
The result is a clear portrait of the modern renovator: resourceful, intentional, and focused on making functional, high-value improvements that reflect how they want to live, now and in the future.
About the 2025 How America Renovates Data
The 2025 How America Renovates report is based on an online homeowner survey, conducted to better understand the financial, emotional, and logistical experiences of U.S. homeowners who have recently completed—or are planning—a major renovation project of $10,000 or more.
To qualify, respondents had to own their home, reside in the United States, and have either completed a renovation of $10,000 or more or be planning one in the near future.
Unless otherwise noted, all insights and statistics refer to homeowners who met the criteria for recent or upcoming major renovations.
Section 1: Snapshot of Respondents
Age and Household Income
Who’s renovating in 2025? A closer look at the homeowners driving today’s renovation boom reveals a cross-generational group, most of whom are middle-income and live in single-family homes.
Of those surveyed, Boomers lead the home reno charge at 36%, but Gen Xers and Millennials are close behind.


|
65% of renovators surveyed earn between $100,000 and $250,000—proof that major home upgrades aren’t just for the ultra-wealthy.
|
Home Type
The vast majority of homeowners are investing in the American dream. Over 93% of renovations are happening in single-family homes across the country.
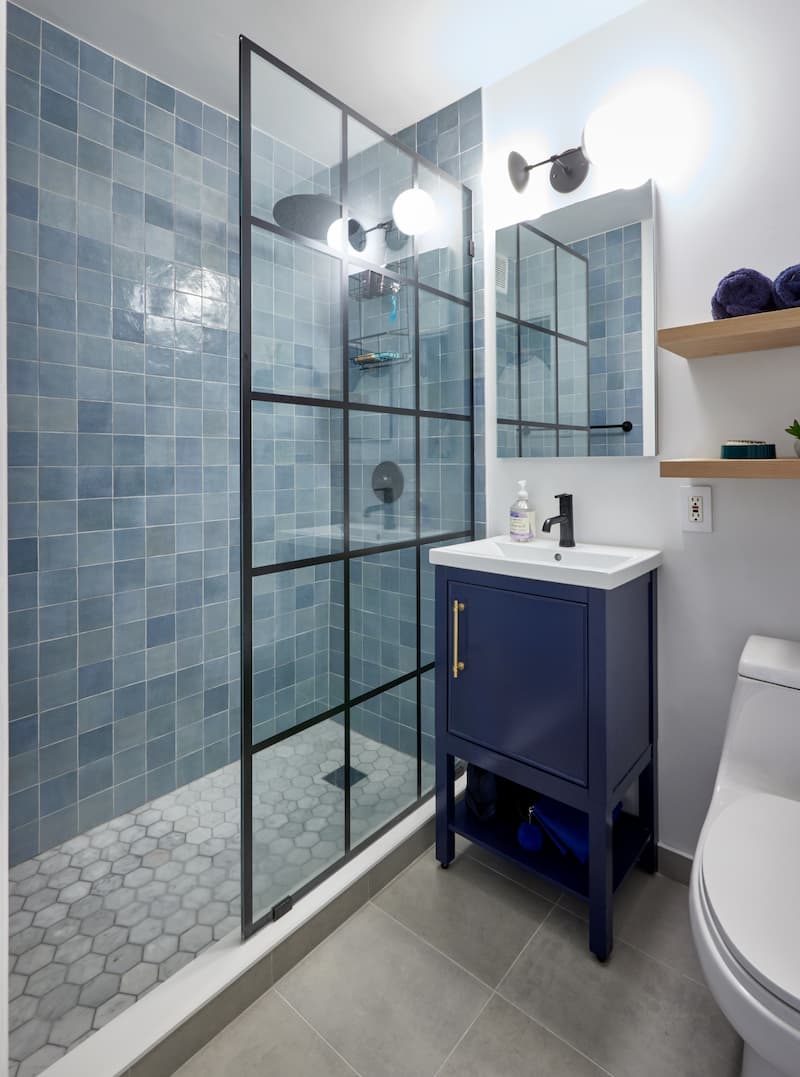
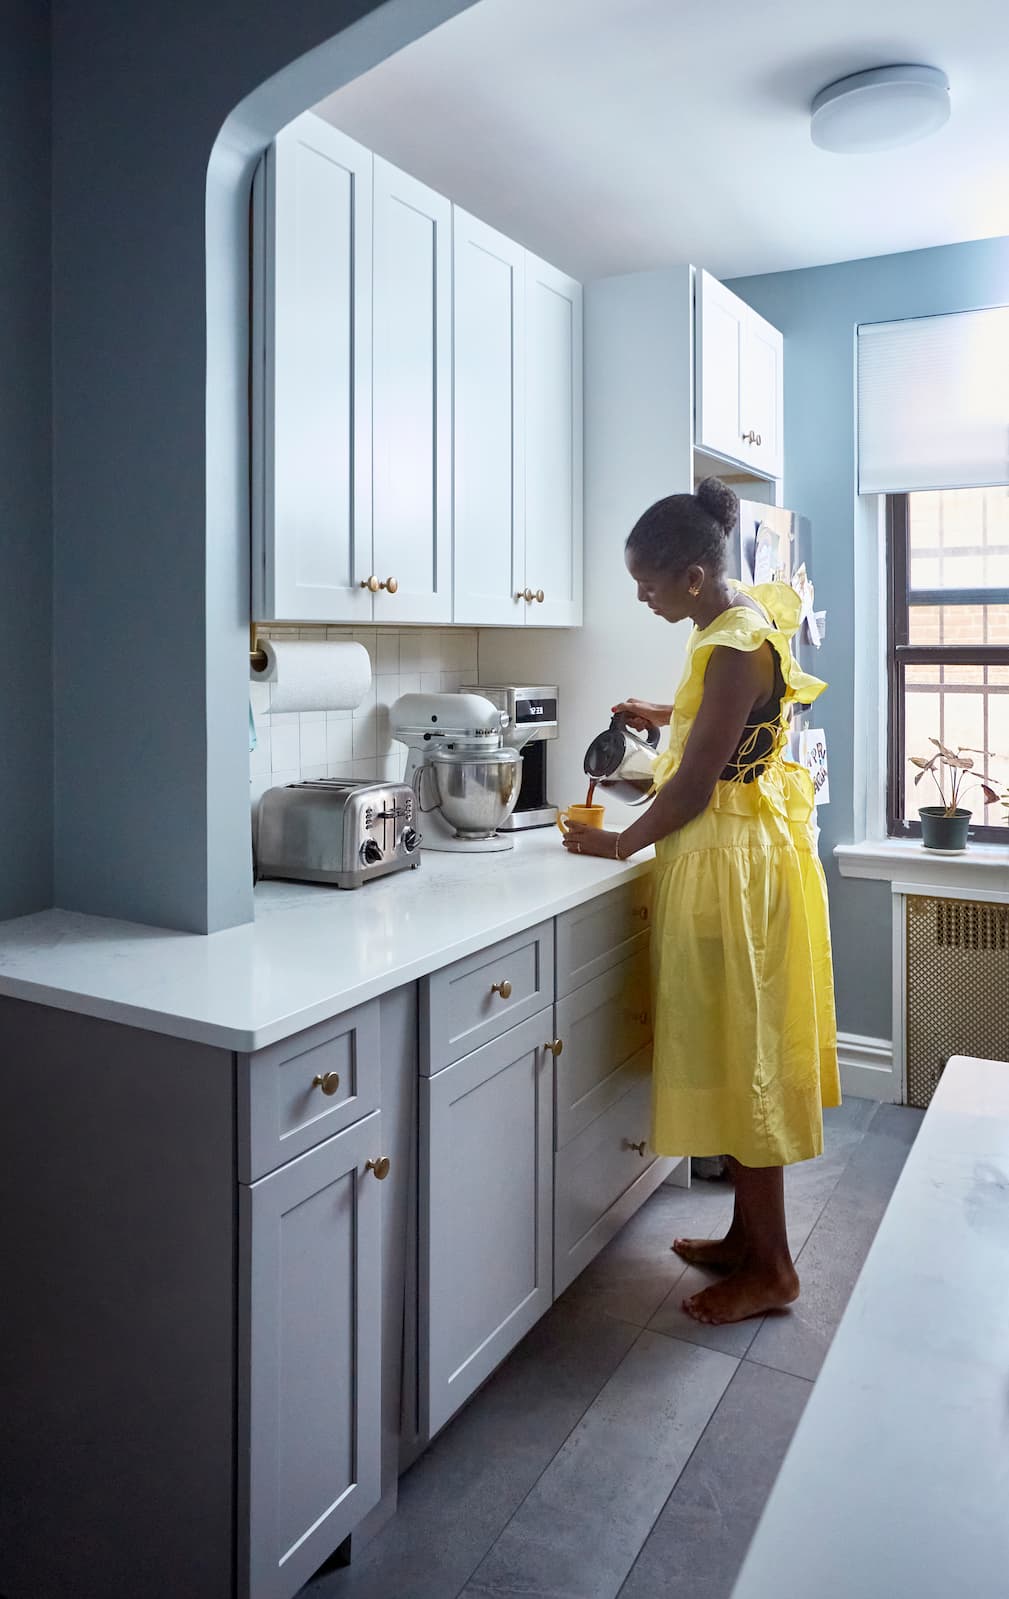
What Americans are Renovating
Bathroom and kitchen remodels tend to cost more, thanks to the fixtures, plumbing, and gas connections involved. But they’re also the most functional rooms in the home, so when homeowners decide to renovate, they invest where it matters most.
Section 2: Finances & ROI
How Americans Are Financing
In an uncertain economy, most homeowners are choosing to renovate with intention—using personal savings instead of taking on debt, setting careful budgets, and making trade-offs to stay within their means. Even when compromises are necessary, the investment feels worthwhile: Many believe their renovations are boosting long-term home value.

|
More than half of homeowners paid for renovations using personal savings alone.
|
How Much Are Homeowners Budgeting for Their Renovation Cost?
The majority of homeowners are budgeting between $10,000 and $25,000 for their remodel cost, with 47% of respondents falling into this range.

Budget Differences by Region
While $10,000–$25,000 is the most common budget range nationwide, regional differences reveal interesting trends:
.png?width=1912&height=1364&name=Block%20Remodeling%20Survey%20-%20Budget%20differences%20by%20region%20(under%20$10k).png)
In the Midwest and South, 25% of homeowners budgeted under $10,000. That number drops to 19% in the Northeast and 15% in the West, where higher budgets are more common.
.png?width=1912&height=1364&name=Block%20Remodeling%20Survey%20-%20Budget%20differences%20by%20region%20(under%20$50k).png)
West Coast homeowners were more likely to spend big, with 16% budgeting over $50,000, compared to 13% in the South.
Renovation Tradeoffs
Many homeowners are making compromises due to budget limitations. If financial constraints were not a factor:
- 39% said they would have made additional major upgrades.
-
26% said they would have made additional minor changes.

|
37% of homeowners say they exceeded
their original renovation budget. |
Price creep is real during the renovation process. Materials (58%) and labor (40%) were the primary drivers of cost overruns. Unexpected repairs (20%) were another major budget disruptor.
Perceived Improvement to Home Value
Most homeowners across all regions felt that renovations increased their home’s value. Only a small percentage (around 7%) said there was no impact.
- Homeowners in the West are the most confident that renovations increased their home value, with nearly 80% reporting 1–25% increase—higher than any other region. Only 2% reported no impact at all, the lowest percentage nationwide.
- Bathroom remodels accounted for 30% of projects in the West, significantly higher than the 23% average in other regions. This suggests that homeowners in the West may view bathroom updates as a key way to boost ROI.
- The Northeast had the highest percentage of homeowners who reported a larger value bump, with 25% saying their home increased in value by 25–50%.
- In the Midwest, a strong majority of homeowners (69%) reported a 1–25% increase in home value after renovating—yet the region also had one of the highest percentages of people (8%) who felt their renovation made no difference at all.
- The South had the most homeowners who believed their renovation boosted value by 50% or more (5%).
- Overall, nearly 93% of homeowners believe their efforts contributed some level of added value.

|
For many homeowners, renovations aren’t just for aesthetics—they’re investments. 71% believe that their upgrade increased their home’s value.
|
Section 3: Stress & Impact
It’s no surprise that stress and emotions run high during renovations. Between the major financial commitment, constant decisions, conflicting opinions, shifting routines, and the chaos of construction, it’s a lot to manage. Here’s how people say they’re handling it.
Most Americans Experience at Least Some Stress During Renovation
Over 85% of homeowners reported experiencing at least slight stress during their renovation process, with moderate stress being the most common response.

But not everyone feels the pressure equally—stress levels vary by generation.
- Boomers were the most relaxed, with 18% saying they felt no stress at all. Millennials, on the other hand, had a rougher go: only 9% reported a stress-free experience, while 67% experienced moderate to high stress.
Generational expectations, budget flexibility, and renovation goals may all play a role in shaping how overwhelming the experience feels.
Renovation Fatigue
Among the respondents who had already renovated, 57% said that they experienced “renovation fatigue”—the physical, emotional or mental exhaustion resulting from the stress, disruptions, and decision-making inherent in ongoing home remodeling projects.
What Are the Main Stressors During a Home Renovation?
Surprisingly, only 26% of homeowners said unexpected budget increases were their biggest pain point. For most, the real headache was the mess, noise, and constant disruption. 55% cited living through construction as their top source of stress.

Relationship Strain
Based on the homeowner survey data, the vast majority of people (76%) did not experience any relationship strain during their renovation. However, 20% reported some strain, and a small group (3%) said it was significant.

Relationship Strain by Generation
Most homeowners across generations did not feel significant emotional strain from home renovation—but age seems to play a role in those who did.
|
Millennials felt more relationship strain during
home renovations than any other generation. |
Only 15% of Boomers and 22% of Gen Xers reported tension with a partner or loved one, compared to 39% of Millennials who said the process put a strain on their relationships.
Renovation Motivations
The leading reason that homeowners cite for renovating tells a positive story: They love where they live and are choosing to invest in upgrades that make their spaces even better.
Among generations, Millennials were the most likely to say they chose to renovate because they couldn’t afford a new home. 17% of Millennials cited that as the reason, compared to only 9% of Boomers.
- New housing affordability concerns drove more renovations in the West, where 16% of homeowners said they renovated because they couldn't afford to buy a new home—the highest percentage among all regions. This contrasts with just 11% in the Northeast.
- 74% of Northeastern homeowners stated they renovated because they loved their existing home but wanted improvements—the highest rate in the country. This group was also the least likely to cite affordability as a constraint.
Section 4: Planning & Digital Tools
The renovation planning process is evolving, albeit at a slow pace. Most homeowners still rely on word-of-mouth referrals to find contractors, and while AI is gaining traction across industries, it's only just beginning to make inroads in home improvement. For now, digital tools remain an underused resource with big potential.
Finding Contractors
For people who have completed a renovation, referrals are the most common way to find a contractor, with 52% of homeowners relying on recommendations from people in their social circle over Google searches (19%) or online platforms (9%).

-
Referrals remain the most trusted method across all generations, but their dominance is strongest among older homeowners.
-
70% of Boomers and 68% of Gen X found their contractor through a friend or neighbor, compared to 50% of Millennials. This suggests that while personal recommendations continue to be most common, younger homeowners may be more open to alternative methods.
Millennials are significantly more reliant on digital search tools and online platforms, with 45% turning to the Internet to find a contractor—far outpacing Gen X (30%) and Boomers (29%). Younger generations are more comfortable doing independent online research and are more likely to trust online reviews of a renovation company over personal referrals alone, signaling a shift to a more digital, platform-driven future.
|
52% of home renovators found their contractor
through a referral from a friend or neighbor. |
Tools
AI is rapidly reshaping the world, but 91% of homeowners haven’t used it for renovations—perhaps due to a lack of awareness of its capabilities, access, or trust in the tools available.
Most homeowners did not use AI tools during their renovation process. Only 9% overall reported using them.
- Digital and AI tool usage is highest among Millennials and lowest among Boomers.
- 33% of Millennials are using digital tools during their home renovation process. 16% are using AI tools.
AI Tool Usage
Design and layout planning tops the list of AI use cases, with 73% of respondents using AI tools for this purpose—indicating a strong preference for visual and creative assistance.
Cost estimation (52%) and virtual design mockups (43%) also see significant usage, highlighting a demand for tools that provide clarity and visualization.
Methodology
The survey was independently fielded between March 2 and March 18, 2025, to a sample of 1,002 qualified U.S. homeowners, 48% female and 52% male. To qualify, respondents had to own their home, reside in the United States, and have either completed a renovation of $10,000 or more or be planning one in the near future.
Unless otherwise noted, all insights and statistics refer to homeowners who met the criteria for recent or upcoming major renovations.

Renovate confidently with Block
Easily compare quotes from top quality contractors, and get peace of mind with warranty & price protections.