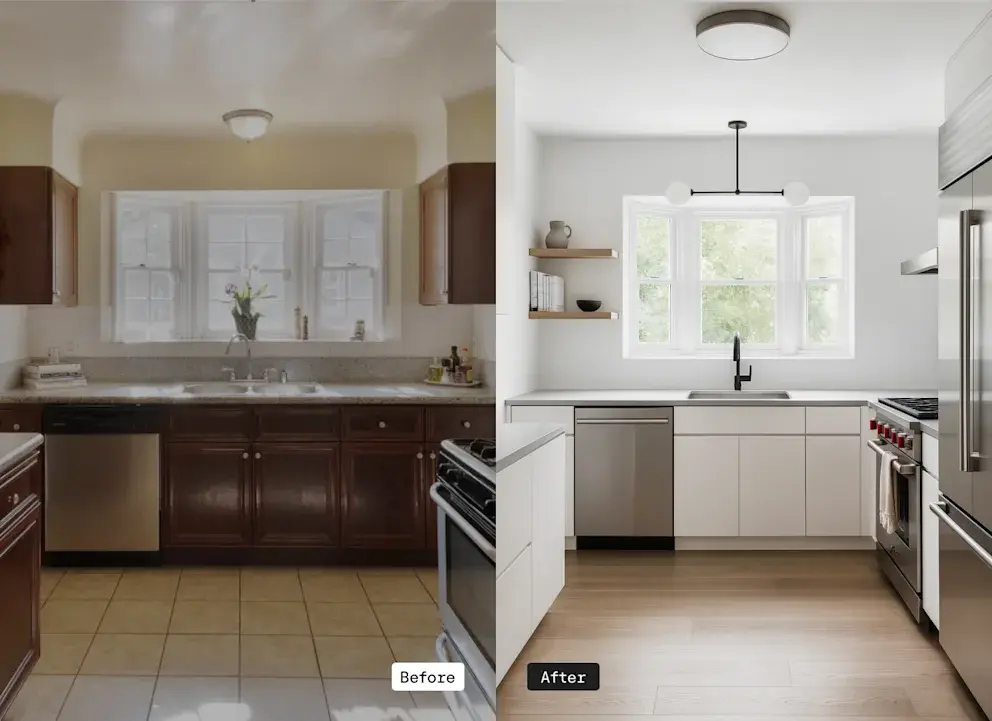
Kitchen Renovation Costs in Castle Rock CO
Castle Rock has seen steady kitchen renovation activity since early 2021, with 114 permits recorded through mid-2025. As one of Colorado's fastest-growing suburban communities south of Denver, homeowners here are investing in their kitchens at a measured pace. At an average project cost of $34,105, Castle Rock renovations come in about 27% below the national average of $46,623 - suggesting a market that leans toward practical, mid-range updates rather than high-end gut remodels. The data below gives you a clear picture of what kitchen renovations actually cost in this community.

Average Project Costs
$34,105
vs National Average
27% below
How does your renovation budget compare in Castle Rock?
This is right around the average renovation cost in Castle Rock.
How we calculate these costs
A renovation permit is official documentation filed with the local Department of Buildings when homeowners undertake construction work. It serves as proof that work is being done to code and represents your best data point for understanding real kitchen renovation costs in Castle Rock. The declared permit value - the estimated cost submitted by contractors or homeowners when filing - provides a reliable baseline for typical project investments, though actual costs may vary. This analysis focuses exclusively on kitchen renovation permits, excluding other room types and new construction to ensure the data accurately reflects what homeowners like you are spending on kitchen upgrades.

Cost data summary
Typical kitchen remodeling cost data in Castle Rock, CO based on renovation permits.
Meet kitchen contractors serving Castle Rock

Understanding labor costs in Castle Rock
Labor costs in Castle Rock generally track close to - and in some trades slightly above - national averages, reflecting the area's position as part of the broader Denver metro market. General contractors typically charge $70-$90/hr (national: $75/hr), plumbers run $85-$110/hr (national: $90/hr), electricians range $80-$100/hr (national: $85/hr), and cabinet makers charge around $85-$110/hr (national: $95/hr). Overall, labor costs in Castle Rock are roughly in line with or marginally above national benchmarks, which helps explain why average project values here remain competitive compared to neighboring Denver-area suburbs where higher labor rates push costs up significantly.
General Contractor
$70-$90
per hour
Plumber
$85-$110
per hour
Electrician
$80-$100
per hour
Cabinet Maker
$85-$110
per hour
Design and budget your next renovation with our free AI tool
Visualize diverse remodeling options
See how design decisions affect your budget in real time
Save and share project plans to guide your renovation journey
How Castle Rock compares to other suburbs
Monthly renovation permit activity in Castle Rock over the past 5 years.
Average Renovation Cost by Suburb
$54,568
$53,949
$52,660
$42,152
$40,529
$33,370
Regional insights for Castle Rock kitchen remodeling costs
Castle Rock's average renovation cost of $34,105 is notably lower than most of its neighboring comparison markets. Centennial, Thornton, and Broomfield all average significantly higher - more than 55% above Castle Rock in some cases. Even Folsom and Carlsbad come in well above Castle Rock's average, while only Rancho Cordova falls in a similar range. This gap suggests Castle Rock homeowners tend to undertake more targeted, budget-conscious renovations, or that the area's newer housing stock reduces the scope of work typically needed. Contractors working in Castle Rock may price more competitively than those serving denser Denver suburbs.
How Castle Rock compares to state & national averages
Understanding how kitchen remodeling costs stack up against national benchmarks helps you budget more accurately.
$34,105
$50,368
$46,623
-26.8
Cost Comparison
Local vs. National Insights
At an average of $34,105, kitchen renovation costs in Castle Rock run about 32% below the Colorado state average of $50,368 and about 27% below the national average of $46,623. This positions Castle Rock as a below-average renovation market by both state and national measures. The gap likely reflects a mix of newer housing stock - which often requires less structural work - and homeowner preferences for functional, mid-range upgrades rather than luxury finishes. For accurate budgeting, use local figures rather than state or national estimates, as Castle Rock consistently skews lower than surrounding metro areas.
Seasonal kitchen renovation trends
Month-by-month patterns in kitchen renovation costs and permit activity in Castle Rock.
Average Renovation Cost
Data represents 4-year average trends (2021-2025) to smooth out year-to-year variations and reveal consistent seasonal patterns in Castle Rock's kitchen renovation market.
Peak Season
Spring Kick-Off and Year-End Surge
March is the busiest month by permit volume with 20 projects, making it the prime time for contractor bookings. May and December post the highest average project values - $57,456 and $78,119 respectively - suggesting that larger, more ambitious renovations tend to start or close out during these periods. If you are planning a major kitchen remodel, expect competition for contractor availability in March and again in late fall.
Transitional Months
Steady Fall Activity
September and October each record 15-16 permits with consistent average costs in the $17,000-$21,000 range. This fall window is a reliable time to schedule mid-range renovations - contractor schedules are still active but not as packed as the spring rush, and lead times for materials tend to be shorter than during peak months.
Slower Period
Winter Quiet and Early Spring Gap
January records no permits at all, and February and June each log just 2. These quieter stretches can work in your favor - contractors are more available, and some may offer more competitive pricing during slow periods. If your project does not require exterior work, a January or February start could mean faster scheduling and more contractor attention on your job.
About this data
Here's how we collect, process, and present kitchen renovation cost data for Castle Rock.
Permit Data Explained
Renovation permits are filed with the Department of Buildings when homeowners undertake construction. The declared permit value - the estimated cost submitted by contractors - serves as a reliable proxy for actual kitchen renovation costs in Castle Rock.
Data Scope
We analyze residential kitchen renovation permits only, excluding commercial projects and new construction. This ensures the data reflects what homeowners are actually spending on kitchen renovations in Castle Rock.
Source and Methodology
114 permits sourced from Castle Rock DOB open data via BuildZoom, covering Apr 2021 to Sep 2025. Records are validated and filtered to remove duplicates and incomplete filings.
Permit data provided by BuildZoom. Data last updated Sep 2025.
© 2026 Block Renovation. All rights reserved.
Ready to start your Castle Rock renovation?
Top quality contractors
Warranty & price protections
Expert resources

Learn more about kitchen renovations
Expert advice and practical tips for planning your Castle Rock kitchen renovation.
Frequently asked questions about renovating in Castle Rock