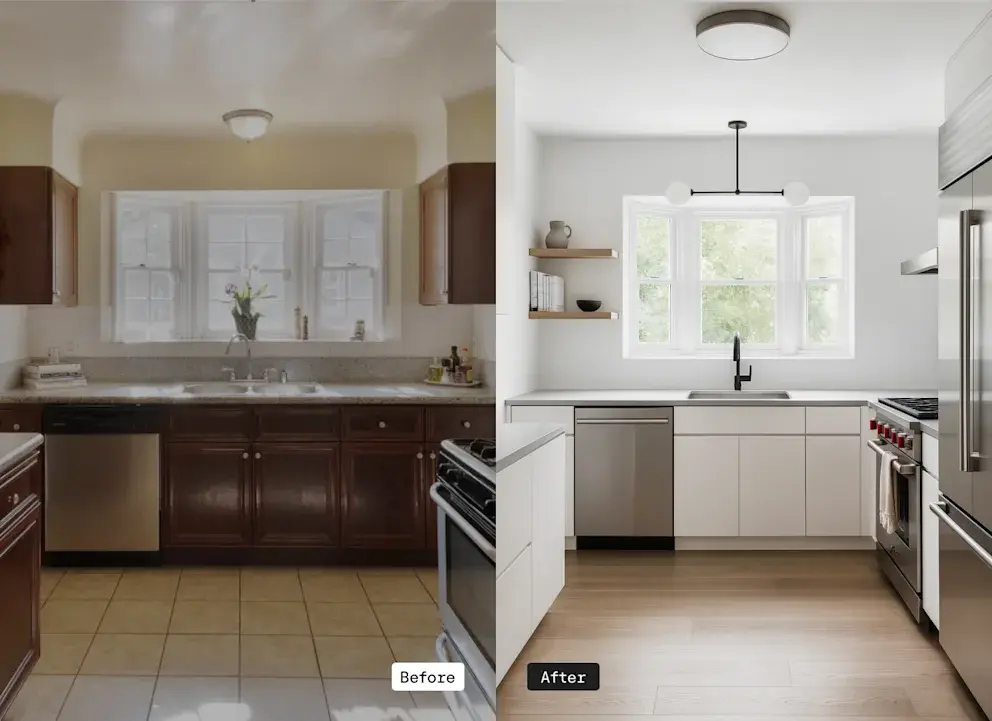
Kitchen Renovation Costs in Granite Bay CA
Kitchen renovation activity in Granite Bay reflects the confidence of homeowners in one of the Sacramento region's most affluent communities. Since early 2021, 216 permits have been recorded, representing a steady and sustained level of investment across this Placer County suburb. At an average project cost of $75,805, Granite Bay remodels run approximately 62% above the national average of $46,623 - a gap that reflects the area's luxury home stock, high-income households, and elevated expectations for materials and craftsmanship. With median home values above $850K, kitchen renovations here represent both a lifestyle upgrade and a sound investment in long-term property value.

Average Project Costs
$75,805
vs National Average
63% above
How does your renovation budget compare in Granite Bay?
This is right around the average renovation cost in Granite Bay.
How we calculate these costs
A renovation permit is official documentation filed with the local Department of Buildings when homeowners undertake construction work. It serves as proof that work is being done to code and represents your best data point for understanding real kitchen renovation costs in Granite Bay. The declared permit value - the estimated cost submitted by contractors or homeowners when filing - provides a reliable baseline for typical project investments, though actual costs may vary. This analysis focuses exclusively on kitchen renovation permits, excluding other room types and new construction to ensure the data accurately reflects what homeowners like you are spending on kitchen upgrades.

Cost data summary
Typical kitchen remodeling cost data in Granite Bay, CA based on renovation permits.
Meet kitchen contractors serving Granite Bay

Understanding labor costs in Granite Bay
Labor costs in Granite Bay run meaningfully above national benchmarks, consistent with the broader Sacramento metro and Placer County's premium market positioning. General contractors in the area typically charge $95-$115 per hour, roughly 27-53% above the national average of $75. Plumbers and electricians similarly command $110-$130 and $100-$120 per hour respectively, compared to national averages of $90 and $85. Cabinet makers serving Granite Bay's luxury renovation market often bill $115-$140 per hour, reflecting the custom work and high-end materials common in this community. These elevated rates are driven by the area's high cost of living, demand for experienced tradespeople, and the complexity typical of estate-scale kitchen remodels.
General Contractor
$95-$115
per hour
Plumber
$110-$130
per hour
Electrician
$100-$120
per hour
Cabinet Maker
$115-$140
per hour
Design and budget your next renovation with our free AI tool
Visualize diverse remodeling options
See how design decisions affect your budget in real time
Save and share project plans to guide your renovation journey
How Granite Bay compares to other suburbs
Monthly renovation permit activity in Granite Bay over the past 5 years.
Average Renovation Cost by Suburb
$69,260
$68,340
$66,582
$58,393
$51,248
$48,524
Regional insights for Granite Bay kitchen remodeling costs
Granite Bay's average kitchen renovation cost of $75,805 stands notably higher than its neighboring comparison areas. Roseville, the closest neighboring city, averages $69,260 - about 9% below Granite Bay's figure. Spring Valley and Murrieta come in around $66,000-$69,000, while Corona averages $58,393, representing a gap of roughly 30%. Elk Grove and Enterprise fall well below at around $49,000-$51,000, less than two-thirds of what Granite Bay homeowners typically spend. These differences are consistent with Granite Bay's luxury market positioning - homeowners here consistently invest more in higher-end finishes, larger project scopes, and experienced tradespeople compared to surrounding communities.
How Granite Bay compares to state & national averages
Understanding how kitchen remodeling costs stack up against national benchmarks helps you budget more accurately.
$75,805
$60,081
$46,623
+62.6
Cost Comparison
Local vs. National Insights
Kitchen renovation costs in Granite Bay sit approximately 62% above the national average and 26% above the California state average of $60,081. This places Granite Bay firmly in the premium renovation tier - not just by California standards but nationally. The gap reflects the community's luxury housing stock, high household incomes, and homeowner preference for custom finishes and professional-grade materials. When planning a renovation here, state and national cost benchmarks are a poor guide - local estimates from Placer County contractors will give a far more accurate picture of what your project will realistically cost.
Seasonal kitchen renovation trends
Month-by-month patterns in kitchen renovation costs and permit activity in Granite Bay.
Average Renovation Cost
Data represents 4-year average trends (2021-2025) to smooth out year-to-year variations and reveal consistent seasonal patterns in Granite Bay's kitchen renovation market.
Peak Season
March and May Drive the Busiest Stretch
March stands out as the highest-value month with an average project cost of $94,439 and 23 permits - the highest permit count of the year. May follows closely with $84,669 and 20 permits. This spring surge aligns with homeowners moving quickly after winter to begin projects before the Sacramento Valley heat peaks in summer.
Transitional Months
Fall Brings a Secondary Wave of Activity
October and November see a meaningful rebound, with October averaging $89,926 across 12 permits and November recording the second-highest permit count at 24. December also stays active at $81,855 and 22 permits, suggesting Granite Bay homeowners continue investing through the holiday season - likely coordinating project completions with year-end timelines.
Slower Period
Summer Months See Lower Average Values
July records the lowest average project cost at $63,313, and June and September also dip below the annual average. While permit counts remain moderate through summer, the lower average values suggest smaller-scope projects during the hotter months - consistent with contractors and homeowners managing construction schedules around Granite Bay's warm summers.
About this data
Here's how we collect, process, and present kitchen renovation cost data for Granite Bay.
Permit Data Explained
Renovation permits are filed with the Department of Buildings when homeowners undertake construction. The declared permit value - the estimated cost submitted by contractors - serves as a reliable proxy for actual kitchen renovation costs in Granite Bay.
Data Scope
We analyze residential kitchen renovation permits only, excluding commercial projects and new construction. This ensures the data reflects what homeowners are actually spending on kitchen renovations in Granite Bay.
Source and Methodology
216 permits sourced from Granite Bay DOB open data via BuildZoom, covering Mar 2021 to Dec 2025. Records are validated and filtered to remove duplicates and incomplete filings.
Permit data provided by BuildZoom. Data last updated Dec 2025.
© 2026 Block Renovation. All rights reserved.
Ready to start your Granite Bay renovation?
Top quality contractors
Warranty & price protections
Expert resources
Learn more about kitchen renovations
Expert advice and practical tips for planning your Granite Bay kitchen renovation.
Frequently asked questions about renovating in Granite Bay