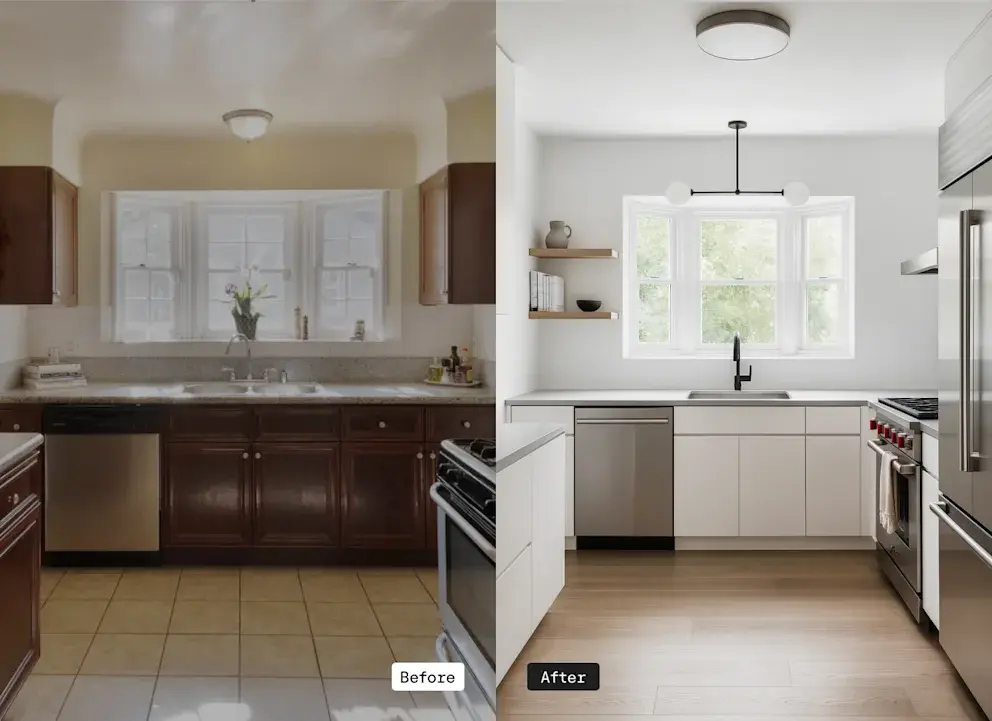
Kitchen Renovation Costs in Haverford PA
Haverford, PA has generated 33 kitchen renovation permits since mid-2022, a modest but telling dataset for one of the Main Line's most prestigious communities. At an average project cost of $51,614, Haverford homeowners are spending about 11% above the national average of $46,623 - a premium consistent with the area's affluent character, historic homes, and median property values above $500,000. The project range runs wide, from targeted refreshes under $15,000 to comprehensive overhauls exceeding $200,000, reflecting a homeowner base with both the resources and the motivation to invest meaningfully in their kitchens. The figures below offer a grounded view of what renovation actually costs in this market.

Average Project Costs
$51,614
vs National Average
11% above
How does your renovation budget compare in Haverford?
This is right around the average renovation cost in Haverford.
How we calculate these costs
A renovation permit is official documentation filed with the local Department of Buildings when homeowners undertake construction work. It serves as proof that work is being done to code and represents your best data point for understanding real kitchen renovation costs in Haverford. The declared permit value - the estimated cost submitted by contractors or homeowners when filing - provides a reliable baseline for typical project investments, though actual costs may vary. This analysis focuses exclusively on kitchen renovation permits, excluding other room types and new construction to ensure the data accurately reflects what homeowners like you are spending on kitchen upgrades.

Meet kitchen contractors serving Haverford

Understanding labor costs in Haverford
Labor costs in Haverford run above national averages, consistent with the broader Main Line market for skilled trades serving affluent homeowners and technically demanding older homes. General contractors in the area typically charge $95-$130 per hour versus the national baseline of $75, a premium of roughly 25-40%. Plumbers command $110-$140 per hour against the $90 national average, electricians run $100-$130 per hour compared to $85 nationally, and cabinet makers - often producing custom work for high-spec Haverford kitchens - typically bill at $110-$145 per hour versus the $95 national benchmark. These premiums reflect the area's cost of living, the specialized skills required for older stone and plaster construction, and the high expectations of a clientele accustomed to quality craftsmanship. Budget labor as your largest variable cost and verify contractor licensing with Haverford Township before signing any contract.
General Contractor
$95-$130
per hour
Plumber
$110-$140
per hour
Electrician
$100-$130
per hour
Cabinet Maker
$110-$145
per hour
Design and budget your next renovation with our free AI tool
Visualize diverse remodeling options
See how design decisions affect your budget in real time
Save and share project plans to guide your renovation journey
How Haverford compares to other suburbs
Monthly renovation permit activity in Haverford over the past 5 years.
Average Renovation Cost by Suburb
$79,556
$64,360
$45,429
$27,371
$25,923
$23,686
Regional insights for Haverford kitchen remodeling costs
Haverford's average renovation cost of $51,614 positions it solidly in the mid-to-upper tier among its comparison communities. Wayne is the clearest outlier above Haverford - by a meaningful margin - reflecting that community's concentration of larger executive homes and higher-specification renovations. Haverford sits well above Bryn Mawr's average, and both significantly outpace Ardmore, McLean, and Arlington, which cluster in the $23,000-$45,000 range. Only Highland Park, at nearly $80,000, consistently exceeds Haverford's average. For homeowners collecting bids, contractors active across the Main Line may bring pricing assumptions from higher-budget markets like Wayne - it is worth benchmarking quotes against Haverford's actual permit data to keep estimates grounded in what local projects genuinely cost.
How Haverford compares to state & national averages
Understanding how kitchen remodeling costs stack up against national benchmarks helps you budget more accurately.
$51,614
$23,306
$46,623
+10.7
Cost Comparison
Local vs. National Insights
Haverford's average kitchen renovation cost of $51,614 sits approximately 10.7% above the national average of $46,623, and a striking 121% above Pennsylvania's state average of $23,306. This dual comparison tells an important story: while Haverford is a premium market by any statewide measure, it does not reach the extreme top of national benchmarks - placing it in a moderate-premium tier relative to the broader country. The wide gap above Pennsylvania's state average reflects how much Haverford diverges from typical suburban PA renovation spending, driven by its affluent demographics, high home values, and preference for quality materials and skilled trades. When planning your budget, use Haverford's local average as your primary reference - the state figure dramatically understates what projects here actually cost.
Seasonal kitchen renovation trends
Month-by-month patterns in kitchen renovation costs and permit activity in Haverford.
Average Renovation Cost
Data represents 3-year average trends (2022-2025) to smooth out year-to-year variations and reveal consistent seasonal patterns in Haverford's kitchen renovation market.
Peak Season
September and Spring Months Drive High-Value Projects
September stands out with the highest average project value at $83,966 across 5 permits, suggesting that fall is when Haverford homeowners launch their most ambitious renovations. January also shows a strong average of $70,825 over 3 permits. June contributes the most activity by volume with 10 permits, though at a more moderate average of $48,923 - making early summer the busiest window overall.
Transitional Months
Late Fall Stays Active with Solid Averages
November sees 4 permits at an average of $55,599, making it a productive transitional window with above-average project values. April contributes 2 permits at $63,875, and March adds 3 permits at a more modest $27,333. These months offer a reasonable opportunity to start a project without competing for contractor time during the busiest stretches.
Slower Period
Summer and Winter Gaps Reflect Low Volume
February and July record no permits at all, and December and August each show just one permit at relatively low averages ($7,000 and $37,464 respectively). October also dips sharply with 3 permits at an average of just $7,995. The very low October average likely reflects a small number of minor scoped projects rather than a true market-wide softening. Budget-conscious homeowners may find contractor availability better in these quieter stretches.
About this data
Here's how we collect, process, and present kitchen renovation cost data for Haverford.
Permit Data Explained
Renovation permits are filed with the Department of Buildings when homeowners undertake construction. The declared permit value - the estimated cost submitted by contractors - serves as a reliable proxy for actual kitchen renovation costs in Haverford.
Data Scope
We analyze residential kitchen renovation permits only, excluding commercial projects and new construction. This ensures the data reflects what homeowners are actually spending on kitchen renovations in Haverford.
Source and Methodology
33 permits sourced from Haverford DOB open data via BuildZoom, covering Jun 2022 to Aug 2025. Records are validated and filtered to remove duplicates and incomplete filings.
Permit data provided by BuildZoom. Data last updated Aug 2025.
© 2026 Block Renovation. All rights reserved.
Ready to start your Haverford renovation?
Top quality contractors
Warranty & price protections
Expert resources
Learn more about kitchen renovations
Expert advice and practical tips for planning your Haverford kitchen renovation.
Frequently asked questions about renovating in Haverford